

JSXGraph for interactive geometry, function plotting and charting

JSXGraph is a cross-browser JavaScript library for interactive geometry, function plotting, charting, and data visualization in the web browser. This is a plugin for RWTHmoodle to enable function plotting and dynamic geometry constructions with JSXGraph within RWTHmoodle. Using the JSXGraph filter makes it a lot easier to embed JSXGraph constructions into RWTHmoodle activities and resources, e.g. in pages, quizzes, books, ...
JSXGraph is a cross-browser JavaScript library for interactive geometry, function plotting, diagrams, and data visualization in the web browser. With this plugin, dynamic geometry constructions and function plotting are made possible in RWTHmoodle. Using JSXGraph, these graphs can be embedded much easier in Moodle activities and materials like pages, quizzes, books, etc.
JSXGraph is developed at the Lehrstuhl für Mathematik und ihre Didaktik University of Bayreuth, Germany.

Note
The new Moodle standard editor TinyMCE removes the <jsxgraph> tag when saving JSXGraph elements. Instead of the JSXGraph element, only an empty white box appears on the rendered page.
You should therefore use the Atto editor or the plain text editor until further notice. Both save the JSXGraph elements correctly. To change the editor, proceed as follows:
- Click on your initials in the top right-hand corner.
- Select Preferences.
- Select Editor preferences.
- Choose either the Atto HTML editor or Plain text area.
1. Activate the JSXGraph filter
To be able to use JSXGraph in a course room, managers must first activate the filter. This renders the JSXGraph code for display as a web page. To activate the filter, proceed as follows:
- Click on "More" in the horizontal menu bar.
- Select "Filter" in the context menu.
- Set the setting for the JSXGraph filter to "On".
- Save the changes. Then go to the place in the course room where you would like to add a JSXGraph board.
2. How JSXGraph works
All users of a course room can use JSXGraph wherever a Moodle editor is available. For example, in text and media areas, text pages, forums, wiki pages, quizzes or the description fields of activities. To add a JSXGraph board, proceed as follows:
- Switch to the HTML view of the editor. To do this, click on the HTML button in the Atto editor
 . Using the plain text area, you can enter the HTML code directly into the text field.
 - In order for the JSXGraph part to be recognized and rendered as a graph, separators are required to separate the JSXGraph part from the rest of the text. The following separators work in RWTHmoodle:
- <jsxgraph> ... </jsxgraph> for inclusion in the HTML modus.
- [[jsxgraph]]... [[\jsxgraph]]in quizzes by using the question type "STACK"
- Each <div> that contains a JSXGraph board requires a unique ID on the page. This ID is generated automatically. It is referenced within the JavaScript with the BOARDID constant.
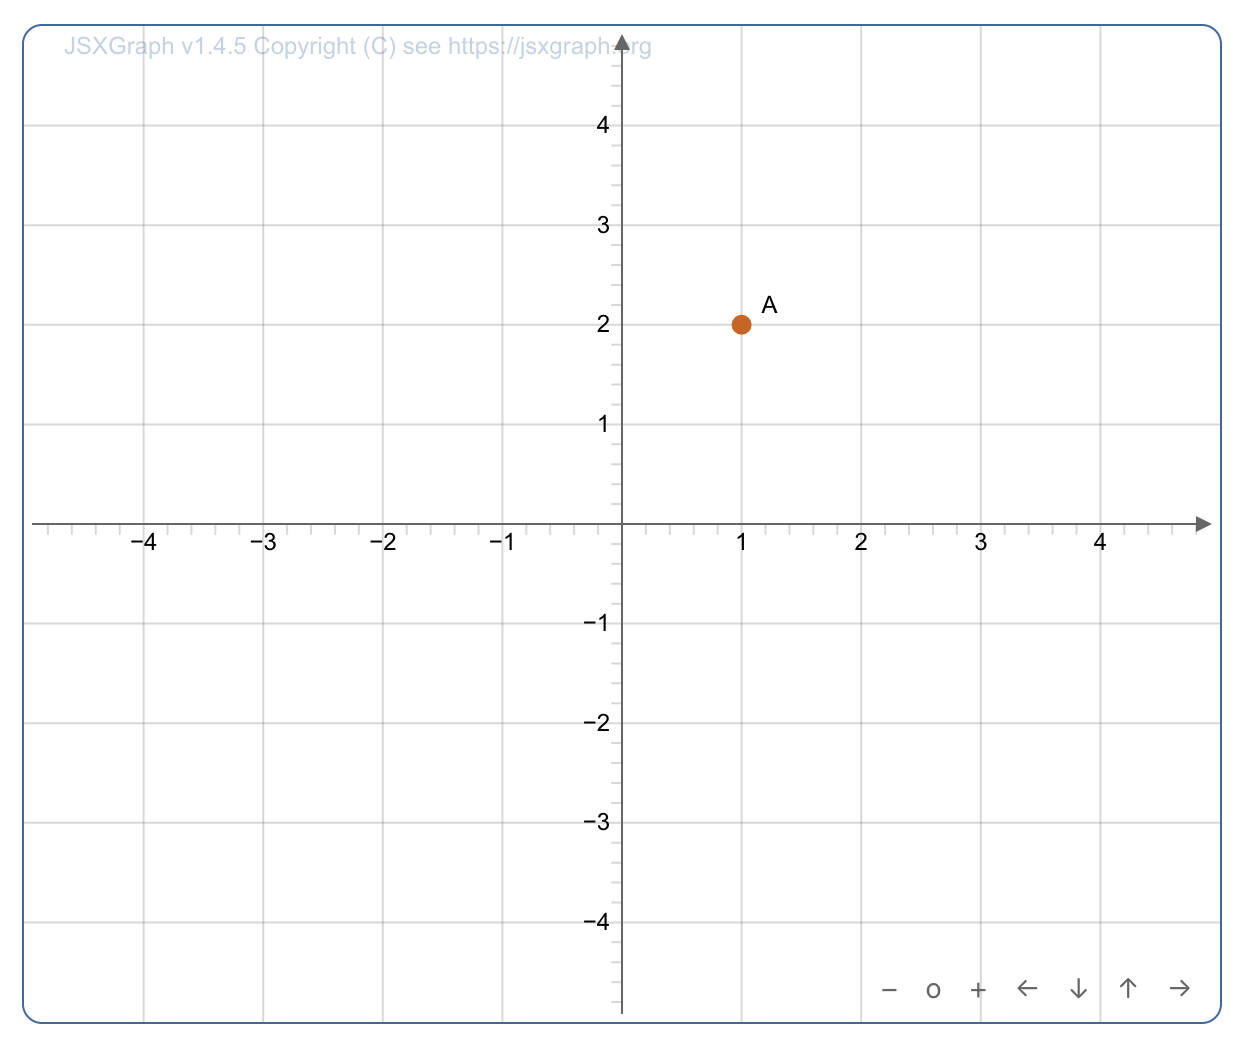
Here's a simple example and how it is displayed:
<jsxgraph width="500" aspect-ratio="1/1">
   var brd = JXG.JSXGraph.initBoard(BOARDID, {boundingbox:[-5,5,5,-5], axis:true});
   var p = brd.create('point', [1,2]);
</jsxgraph>
For more detailed information, see this Moodle tutorial on using JSXGraph from the Moodle plugins directory and the ReadMe page of the plugin on GitHub. It also explains how to use multiple boards within a <jsxgraph> tag.
The STACK question type uses its own extension for JSXGraph. Its use is explained on the Authoring with JSXGraph page in GitHub.
3. Examples
The Share JSXGraph page offers numerous code examples that can be exported for use on Moodle pages with a single click.
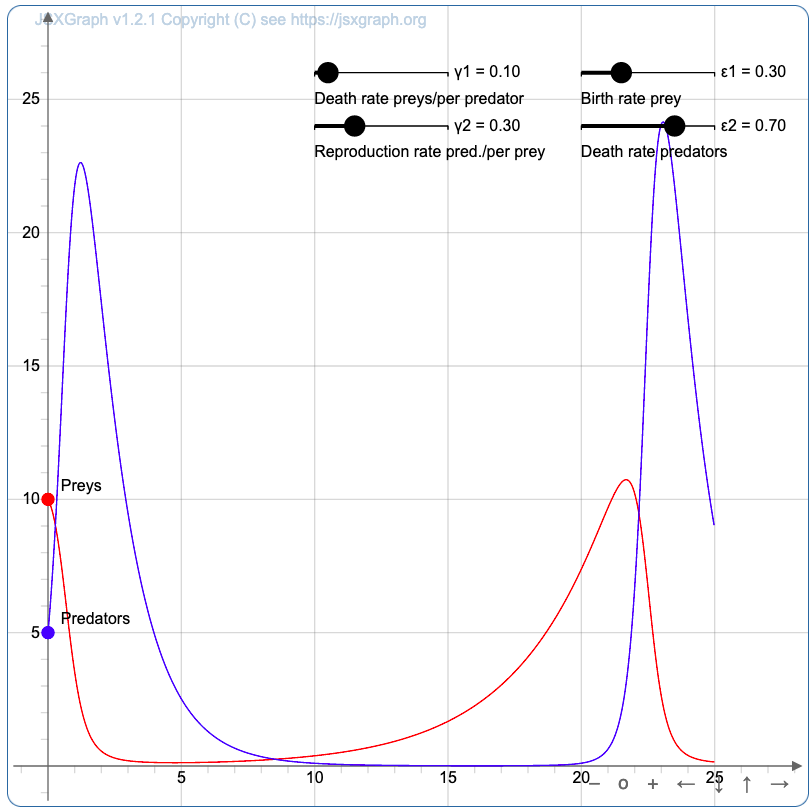
The University of Bayreuth provides a collection of Code examples in the JSXGraph wiki. A smaller collection is available on the JSXGraph homepage. All examples are provided under the GNU Free Documentation License 1.2. The following example is a Plot of a Lotka-Volterra equation, taken from the JSXGraph homepage. The vales can be changed via the sliders so the visualization will change.