


Displaying usage statistics

The "Learning Analytics Dashboard" of Usage Statistics bundles a number of key figures on course room usage. From here you can go to further figures and visualizations.
The history shows the number of all accesses in the respective week. If it is a current course room, the beginning of the current week is marked by a dotted line. Numbers for the current week are not displayed.
The lower area displays important key figures from the course room. In addition, each box contains a link to further statistics on:

- Participants
- This represents the total number of participants enrolled. The change compared to the previous week is shown below this. Click on the link to view more information about the participants.
- Hits
- This display shows the number of hits within the last 7 days. The change compared to the previous 7 days is shown below this. By clicking on the link you can go to a heat map, which visualizes the number of hits over the entire semester.
- Quizzes and Assignments
- This shows the number of quiz attempts and assignment submissions over the last 7 days. Below, the changes from the previous 7 days are shown again. By clicking on the link you can view details about the quizzes and assignments in the course room.
- Most used activities
- This evaluation shows the three most used activities of the last 7 days. By clicking on the link you can view details about the activities of the course room.

Participants provide you with an overview of the course rooms already visited by the participants as well as course rooms that are visited parallel to this.
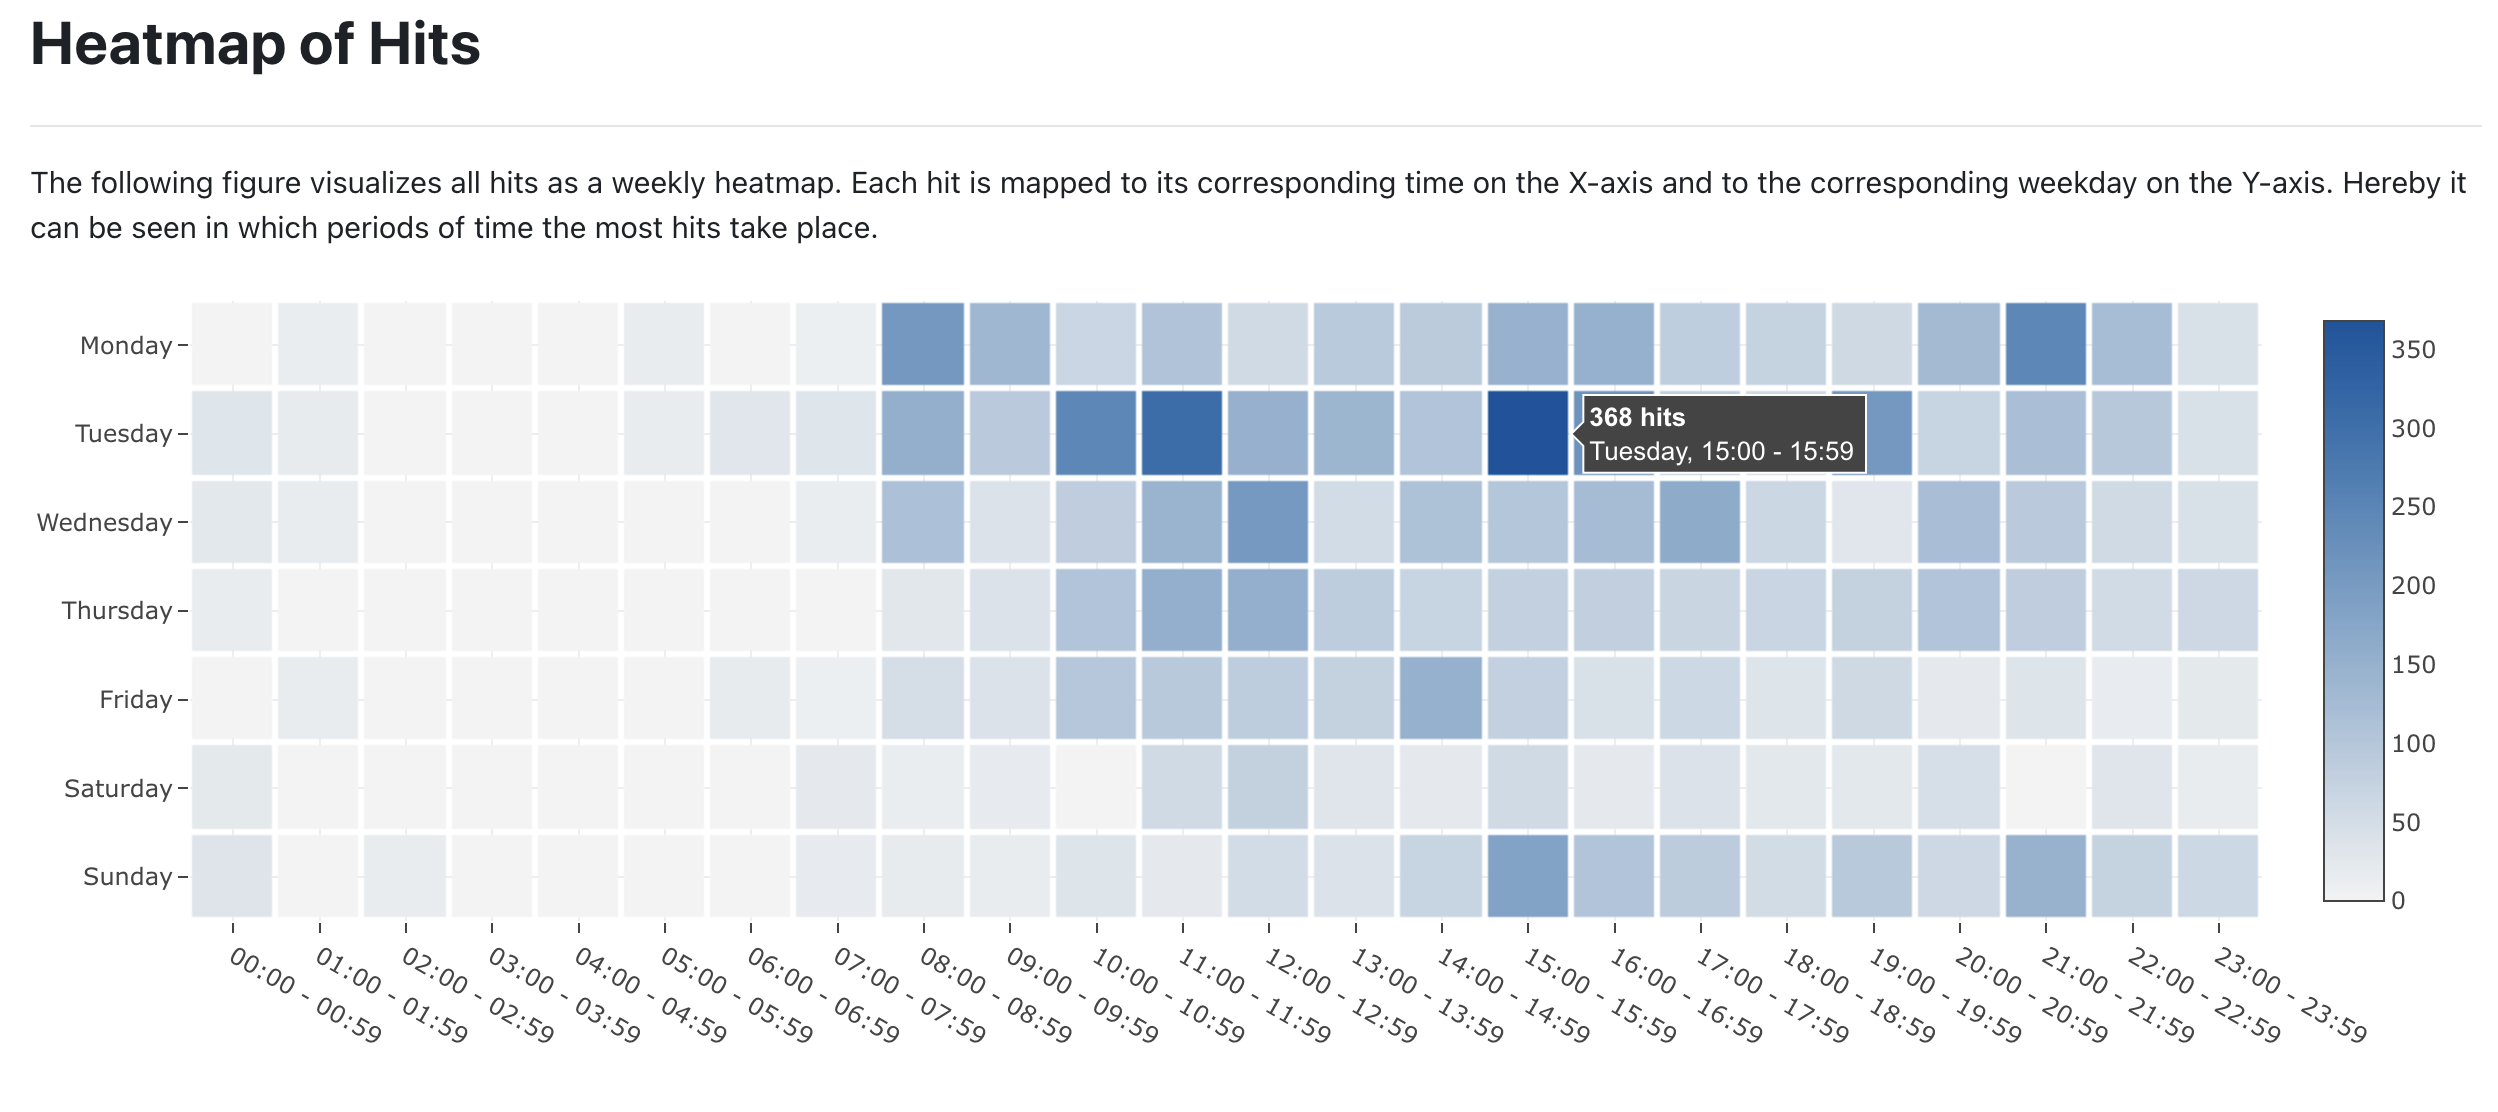
This display shows all hits as a weekly heat map. Each access is assigned to its corresponding time on the X-axis and to the corresponding weekday on the Y-axis. This makes it easy to see the time periods with the most hits.
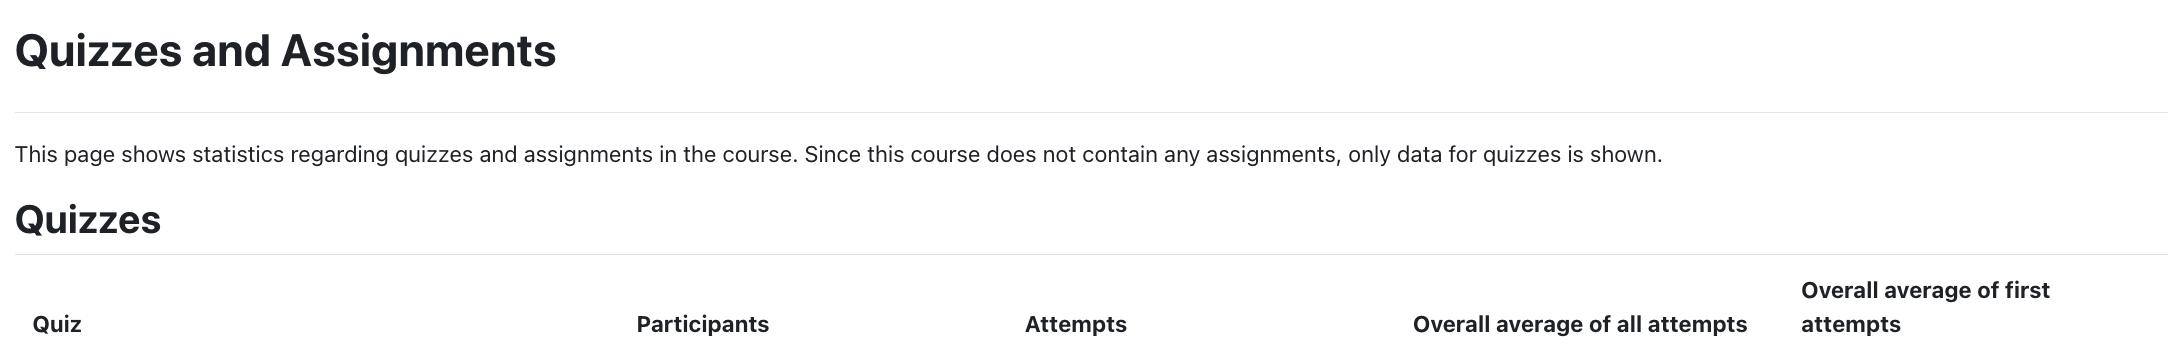
This page displays statistics about quizzes and assignments of the course. For quizzes, it displays the students who have already taken the tests, the attempts, the average of all attempts and the average of all first attempts.
For assignments, the number of submissions and the average of all attempts are shown.

In this view, you get an overview of the hits per activity. The sorting is based on the order of the activities in the course. The table provides a breakdown of the hits to the activities. Below that the user activities are displayed.
The Learning Analytics plugin, which provides part of the data for the statistics, was developed with data protection in mind. All data collected in it are logged and stored anonymously.
The Privacy Policy (only available in German) for RWTHmoodle contains additional details for the purpose of information and transparency:
Together with the general access statistics for a course room room, anonymized statistics on access to videos on the RWTH streaming server are also displayed. These are collected anonymously with the web analysis tool Matomo. Saved in the tool are:
- IP address of the user (in anonymized form)
- Date and time of the action
- Title of the page called up (Page title)
- URL of the page called up (Page URL)
- URL of the previously accessed page (referrer URL)
- Screen resolution of the user
- Time in the user's time zone
- Files that were clicked and downloaded (Download)
- Links to an external domain that were clicked on (outlink)
- Page generation time (Page speed)
- Origin of the user: country, region, city, approximate latitude and longitude (Geolocation)
- Browser language (Accept-Language header)
- User agent of the browser (User-Agent header)
All data is stored anonymously and does not allow any conclusions about the user. The statistics can be accessed in the participating course rooms by all participants of the event via a link in the navigation. Aggregated data will therefore only be displayed in the statistics if at least 10 data sets are available. Otherwise, only "< 10" is displayed.
