Job Monitoring

We offer (postmortem) performance monitoring for all HPC jobs. Users can log in at perfmon.hpc.itc.rwth-aachen.de. The visualization is realized using Grafana with some custom modifications to ensure data privacy.
This tool helps you to get a high level overview of the performance characteristics of your application. Especially, it helps you to easily verify if your batch job is running as expected and to identify (performance) issues.

Who Can Access the Tool
Everyone who can log in via the RWTH RegApp can access the tool.
Usage
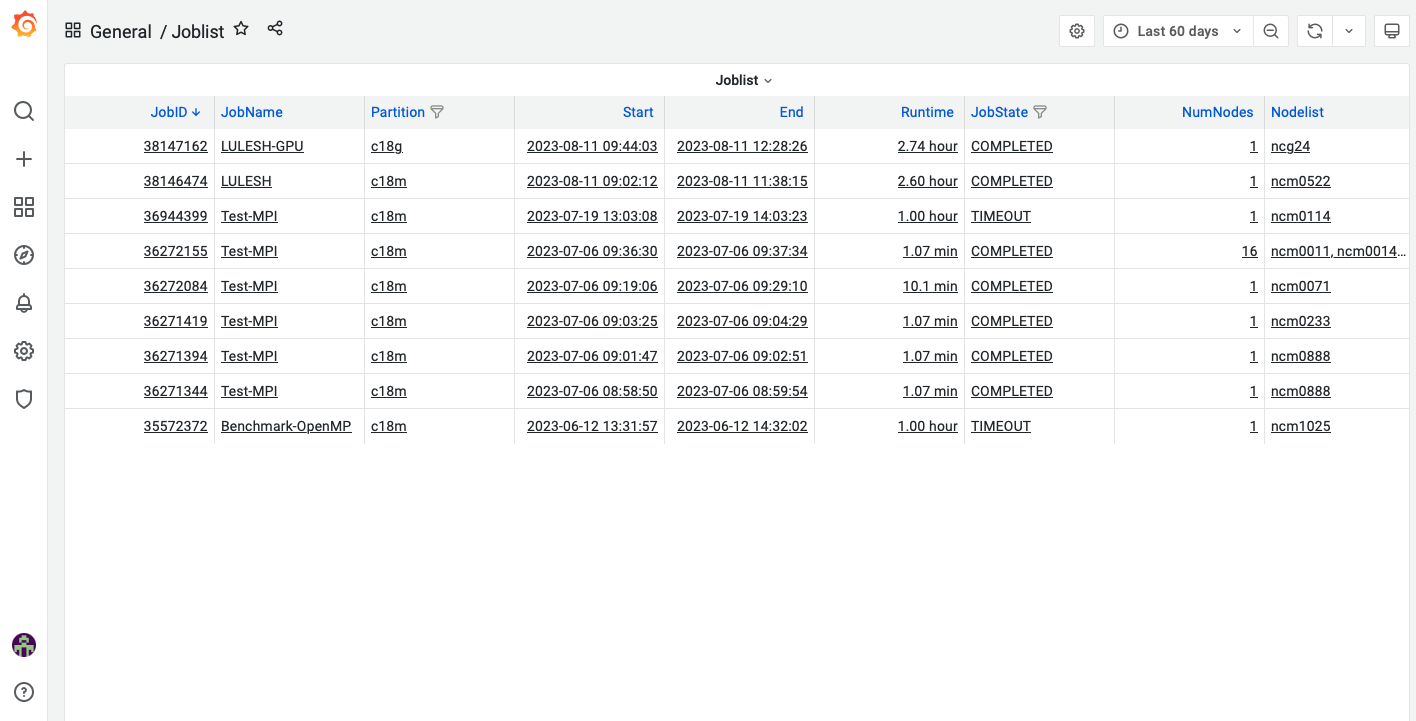
After login, you get a list of your recent jobs. You can always return to this page by clicking on the Grafana logo on the top left of the page.
In the top right corner you can change the time frame you want to see jobs for.

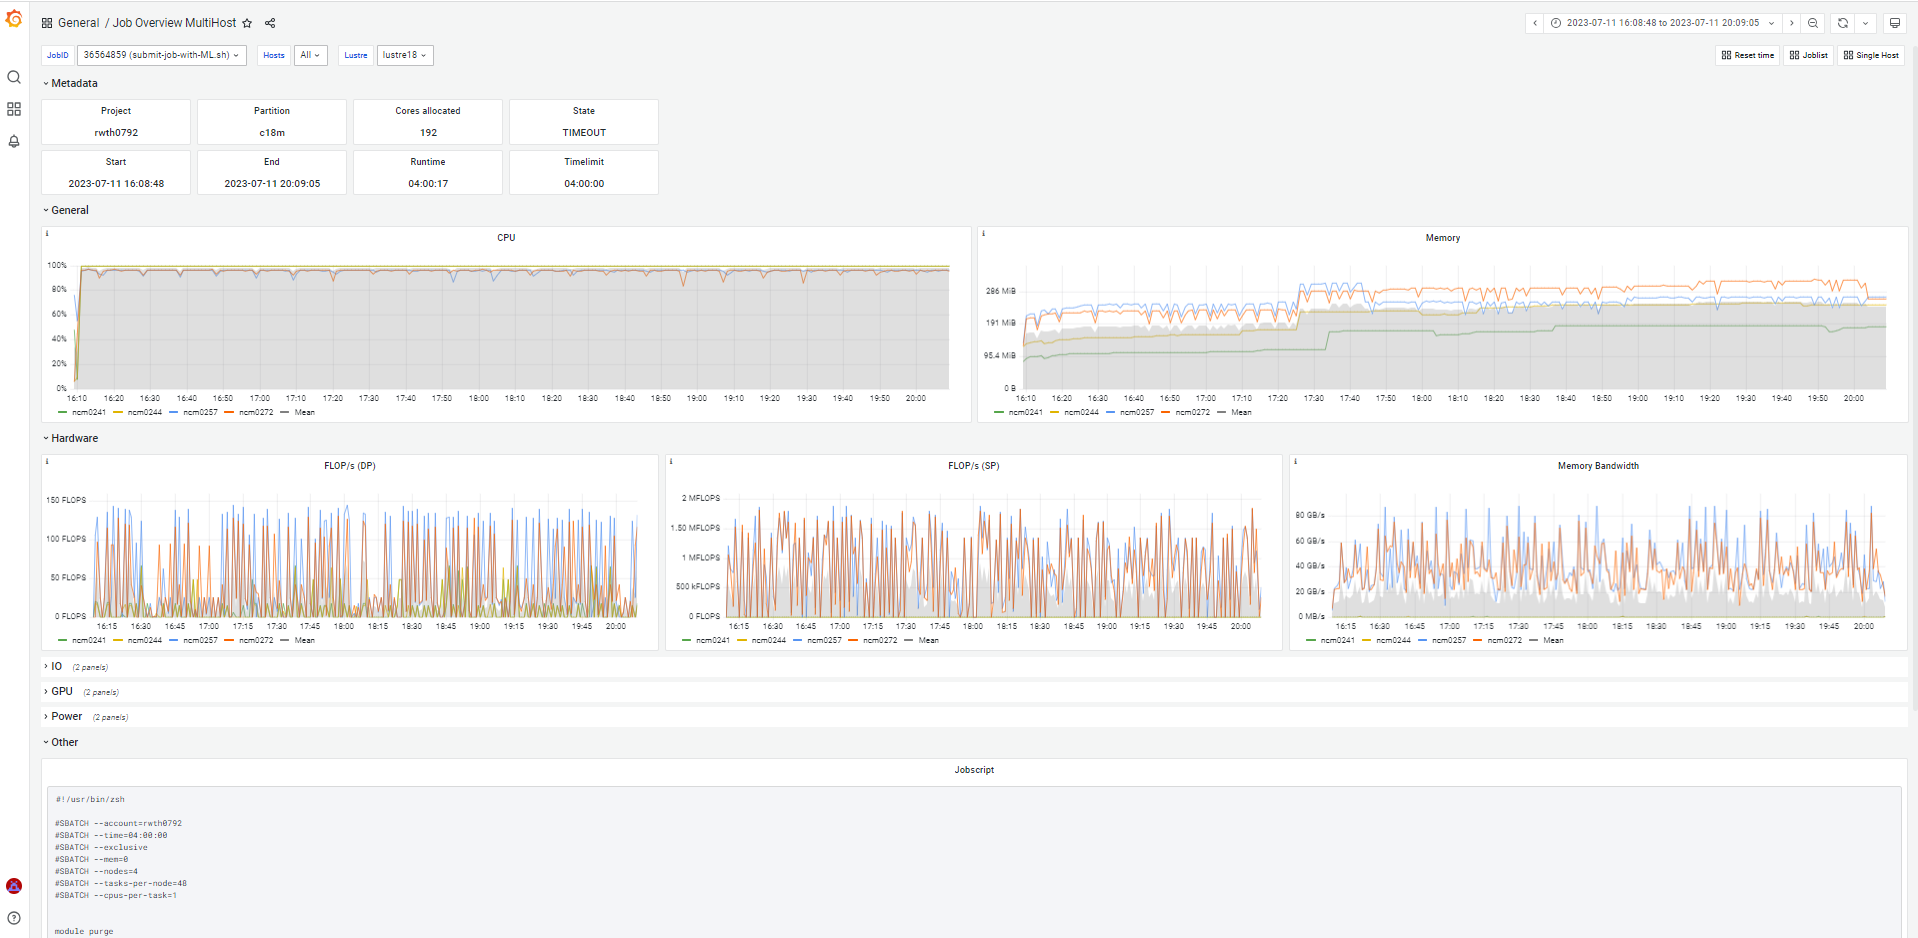
Clicking on a job in the table gets you to performance data for that job. For jobs that ran on a singe node, you get a dashboard that shows the data per core (if available). For jobs running on multiple nodes, the dashboard shows the mean for arch host. On the top right, under the time selector, you can switch between the two views by clicking on "Single Host"/"Multi Host"
When looking at the performance data, there are some variables in the top left. There you can change e.g. which hosts are shown or even change to a different job. When you change the JobID you are viewing, the time frame unfortunately doesn't adjust automatically. To fix it, you need to click on the "Reset time" link in the top right corner.

What Performance Data ist Available
There are two types of data available: data provided by the OS and data derived from hardware performance counters. The data provided by the OS is always available. The data derived from hardware performance counters is not available when the user requested access to the hardware performance counters (e.g. by using --hwctr=likwid).
- OS provided
- CPU usage per core
- Memory usage
- Fabric throughput
- Lustre IO
- NFS IO
- For GPU jobs additionally:
- GPU usage
- GPU memory usage
- hardware performance counter derived
- FLOPS (double precision) per core
- FLOPS (single precision) per core
- Memory bandwidth
- Power consumption per socket
- DRAM power consumption per socket
All data mentioned above is sampled once every minute. Additionally, also the batch script of the job is shown.
Common Issues
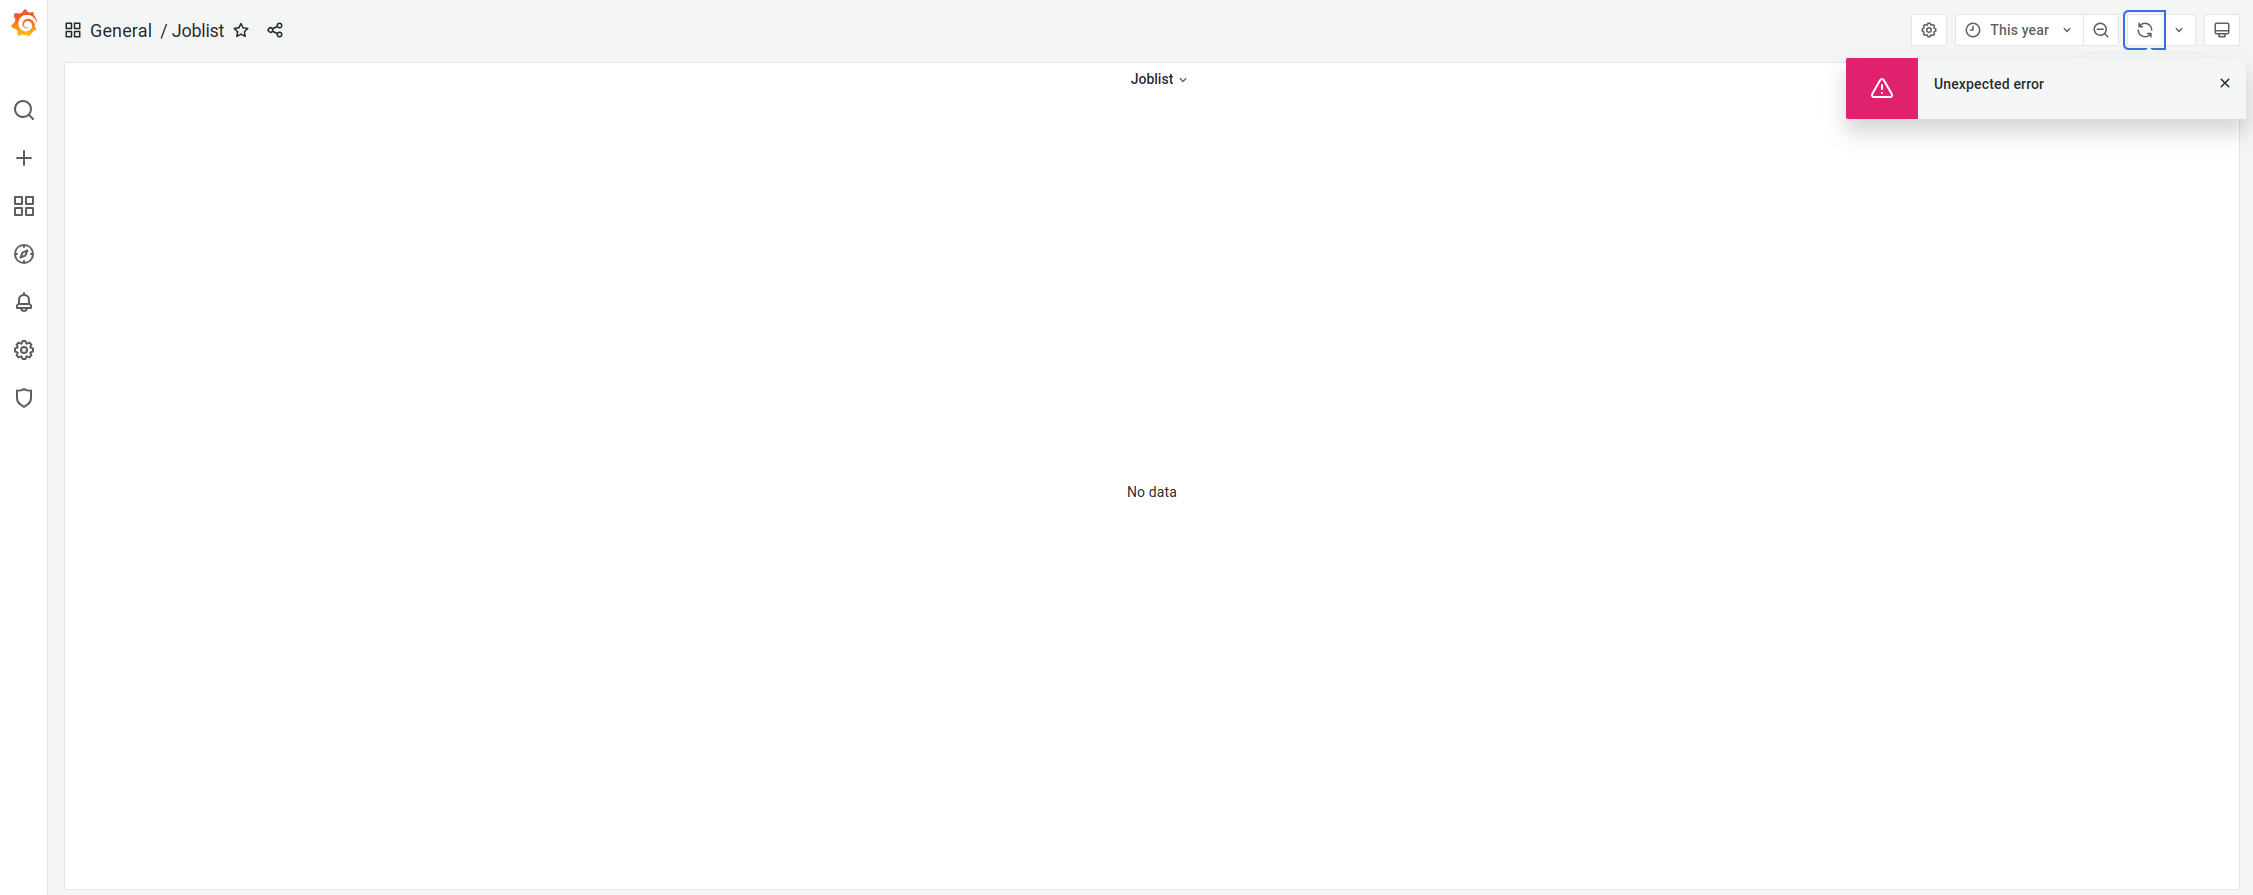
When Grafana shows red error messages in the top right corner, try refreshing the page. Most likely your Shibboleth session timed out, and you need to log in again.


