


Dashboard

On this page you will learn what the dashboard contains and how you can personalize it.
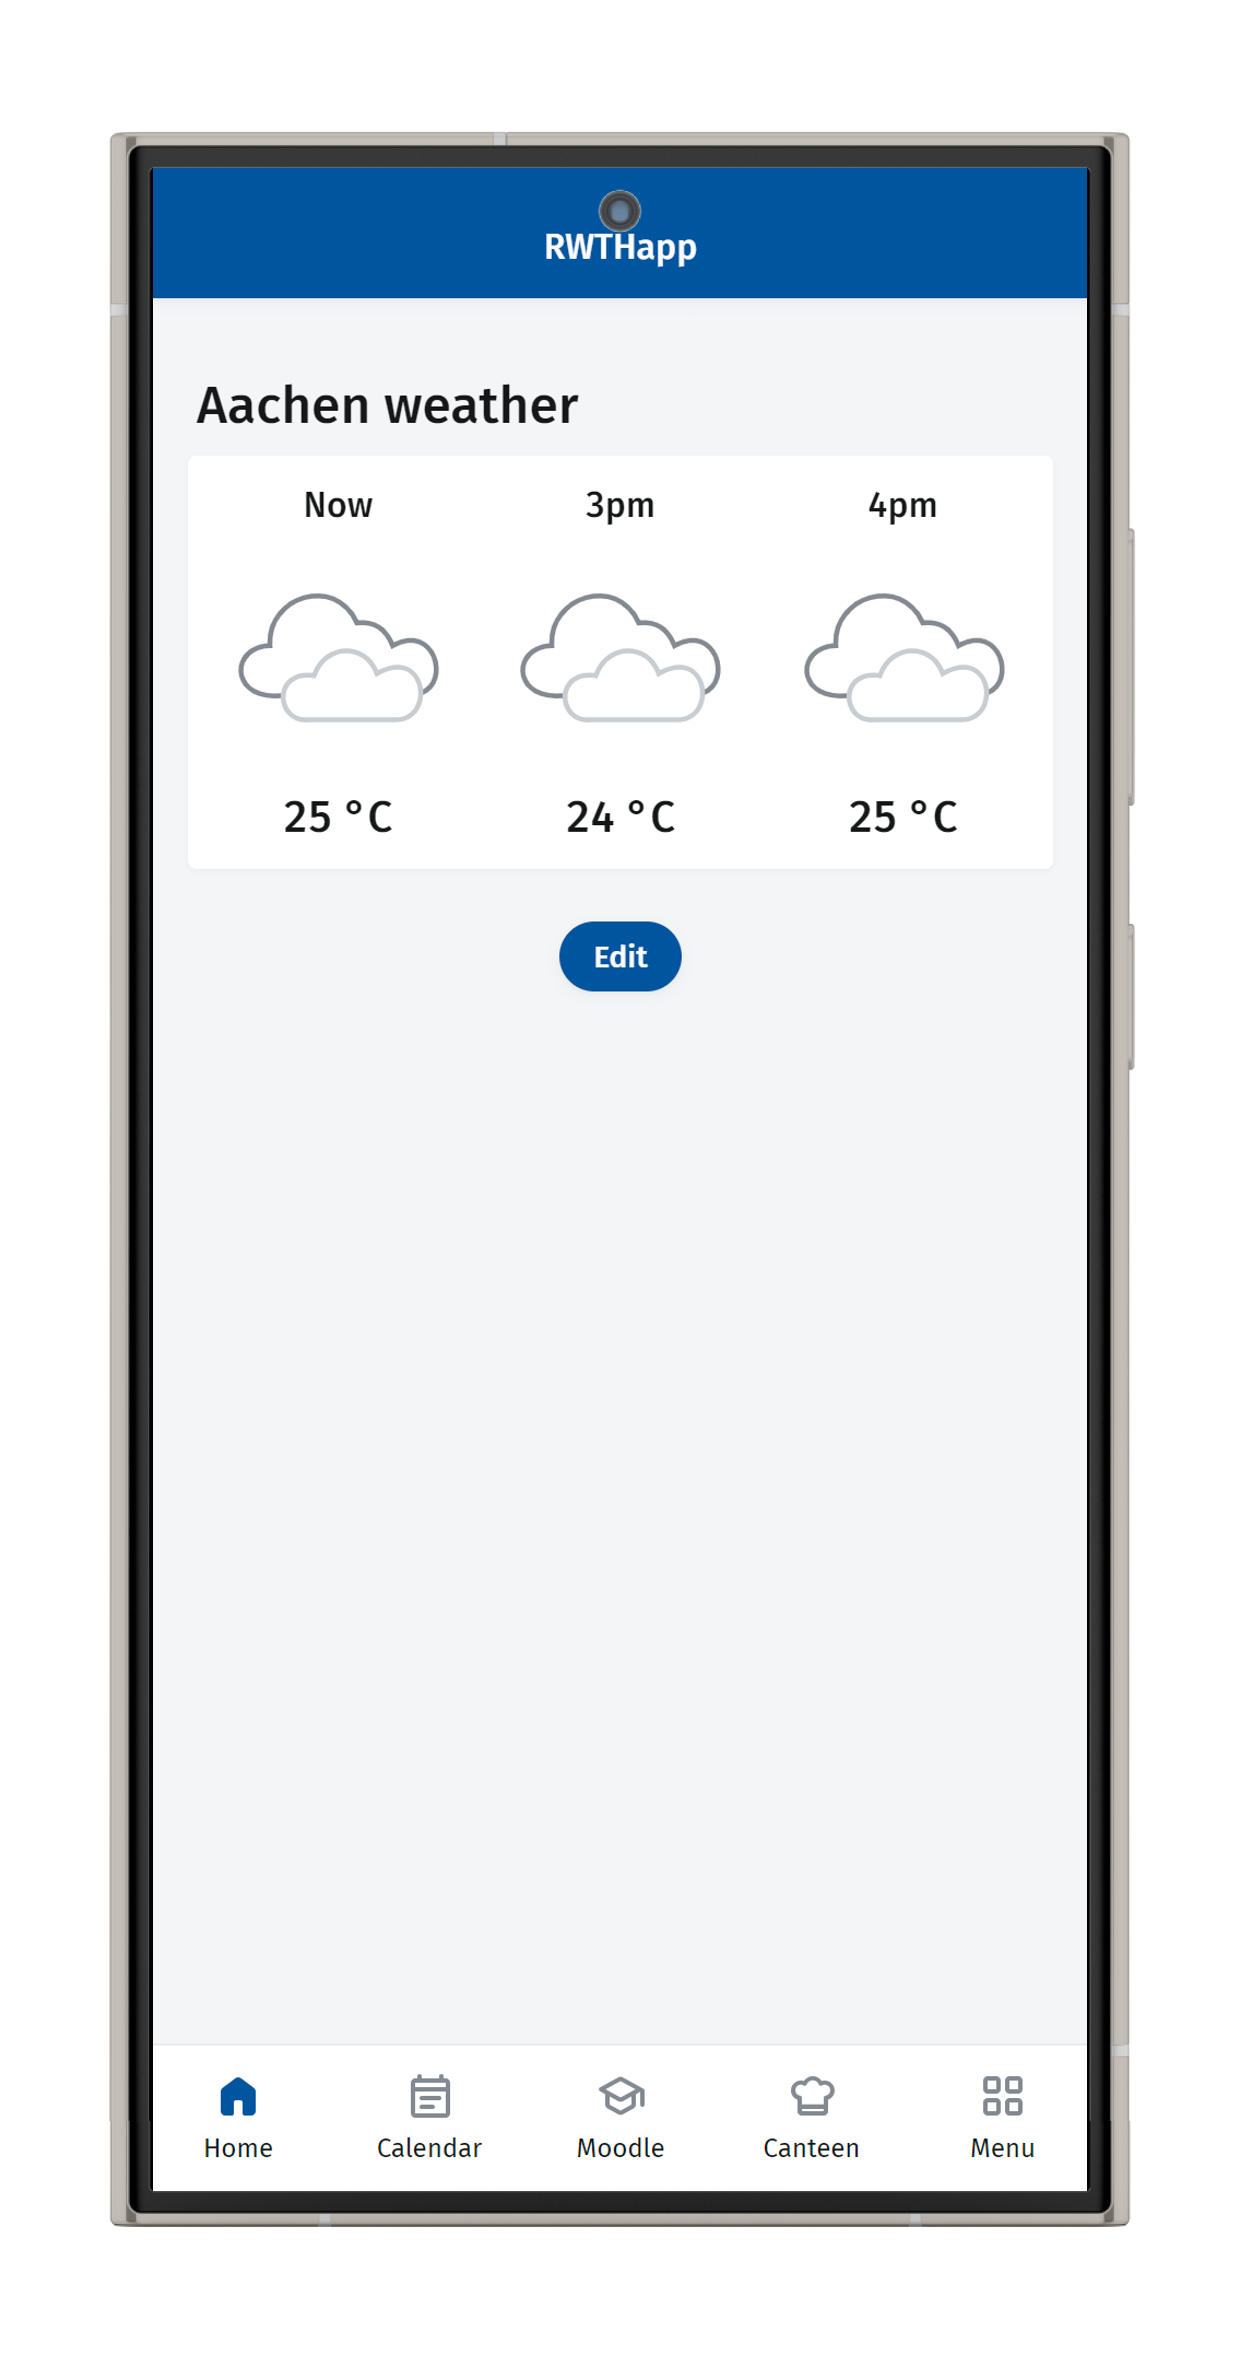
When you open RWTHapp, you will land on the Dashboard. You can return to this view at any time via the Home button.
You can personalize the dashboard as follows:
Instructions
Step 1
To personalize the dashboard, click on the blue Edit button.
Step 2
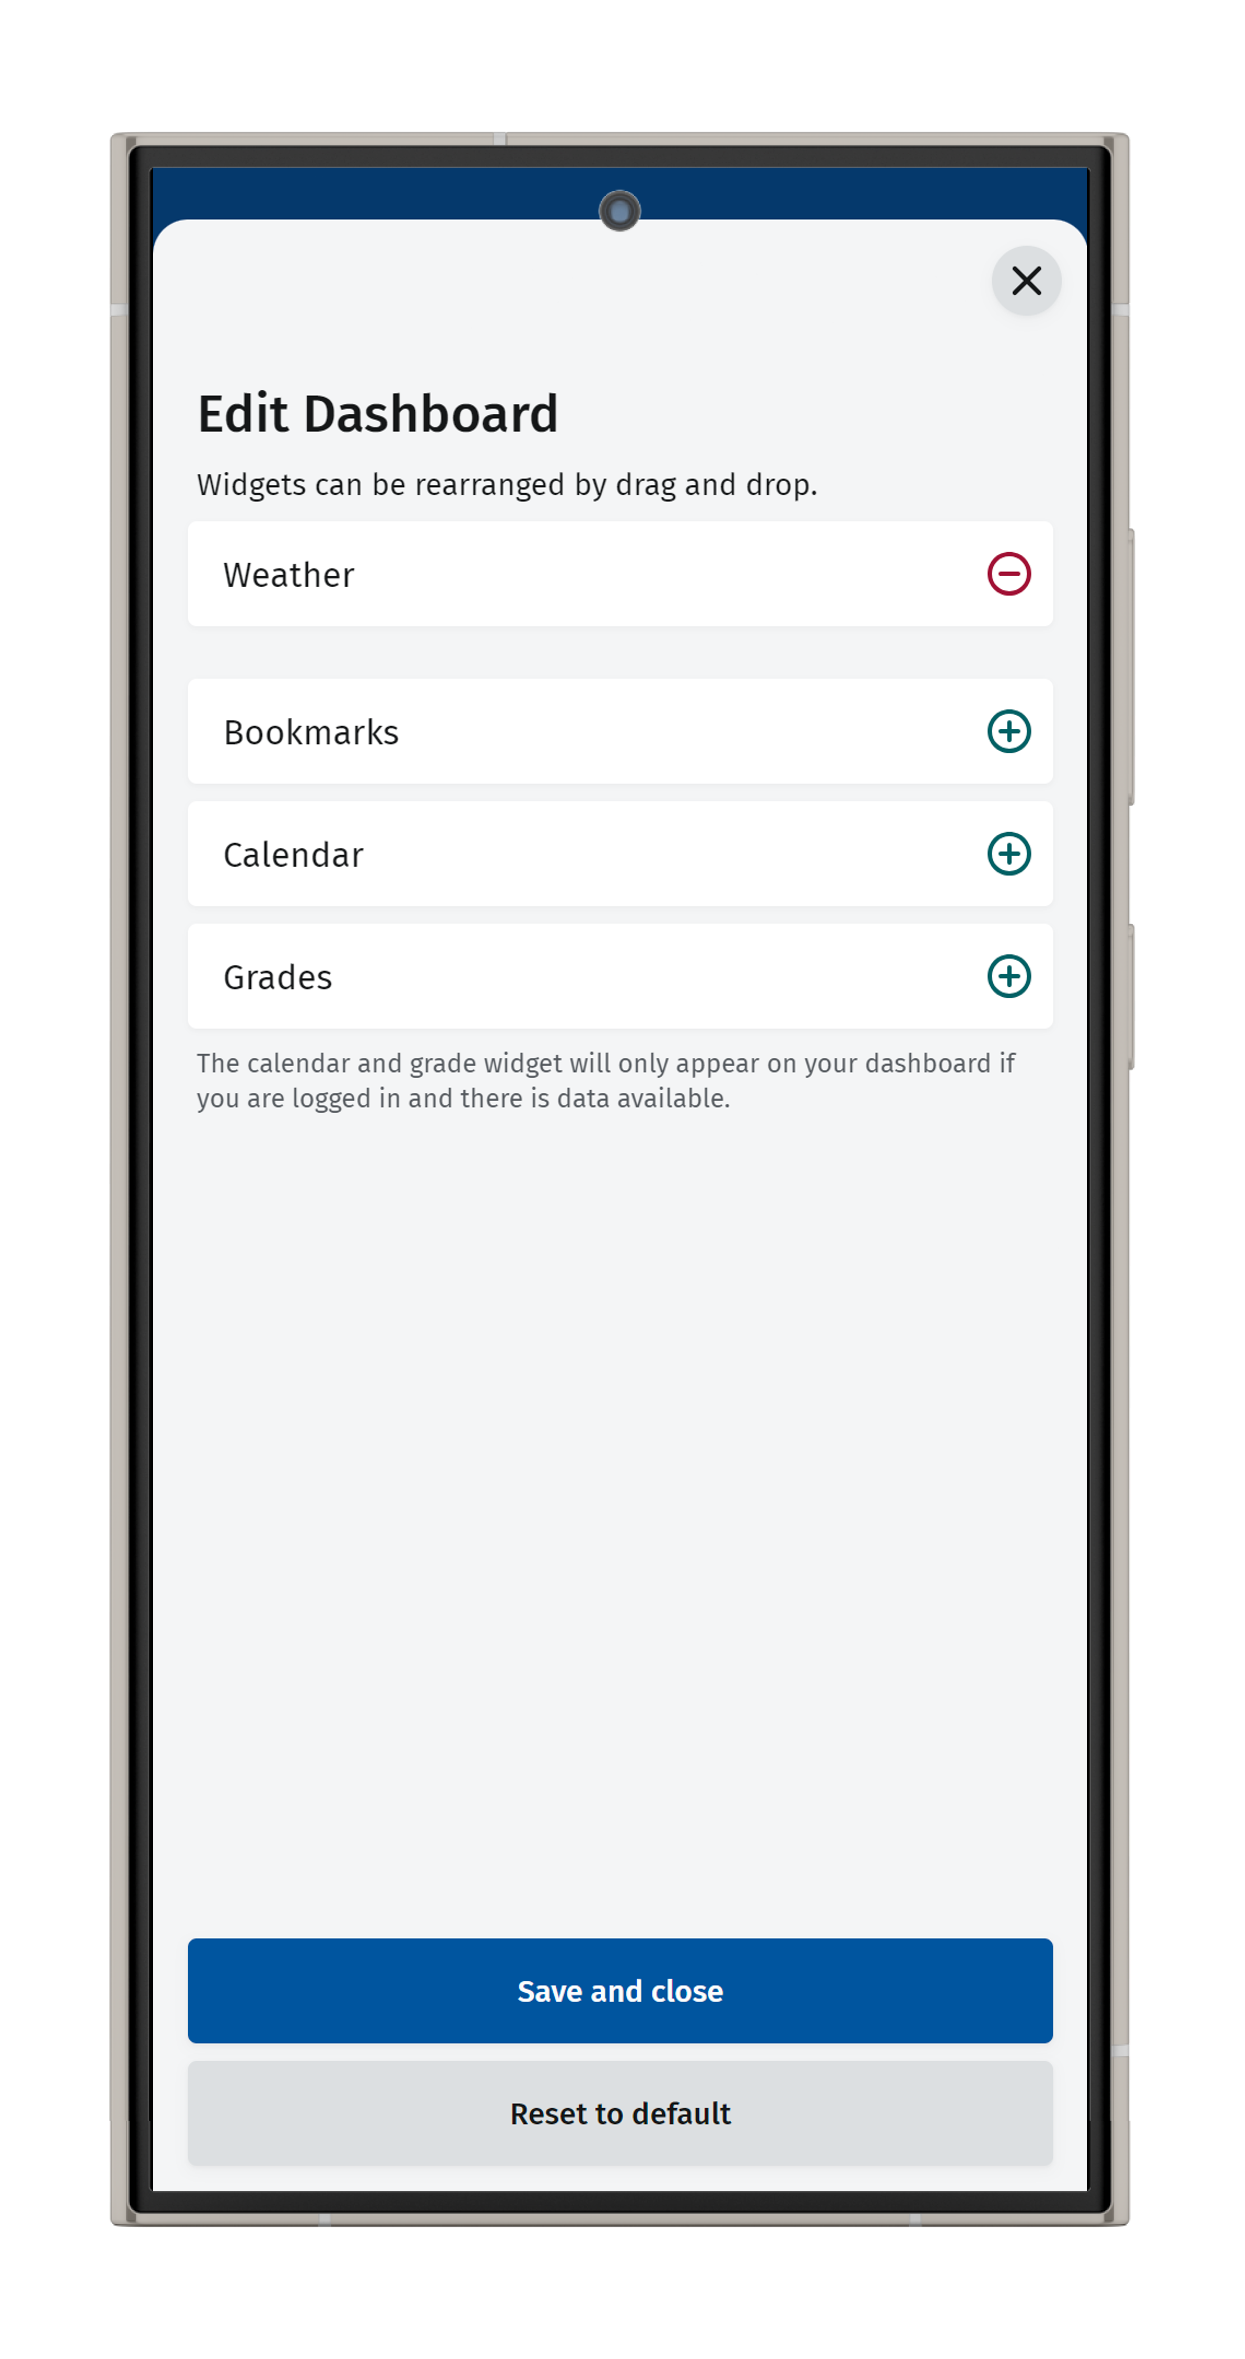
Select the functions that should be added or removed from your dashboard. The order of the functions can be changed via drag and drop.
Step 3
Then click on Save and close to apply your selection:
Further Information
Favorites
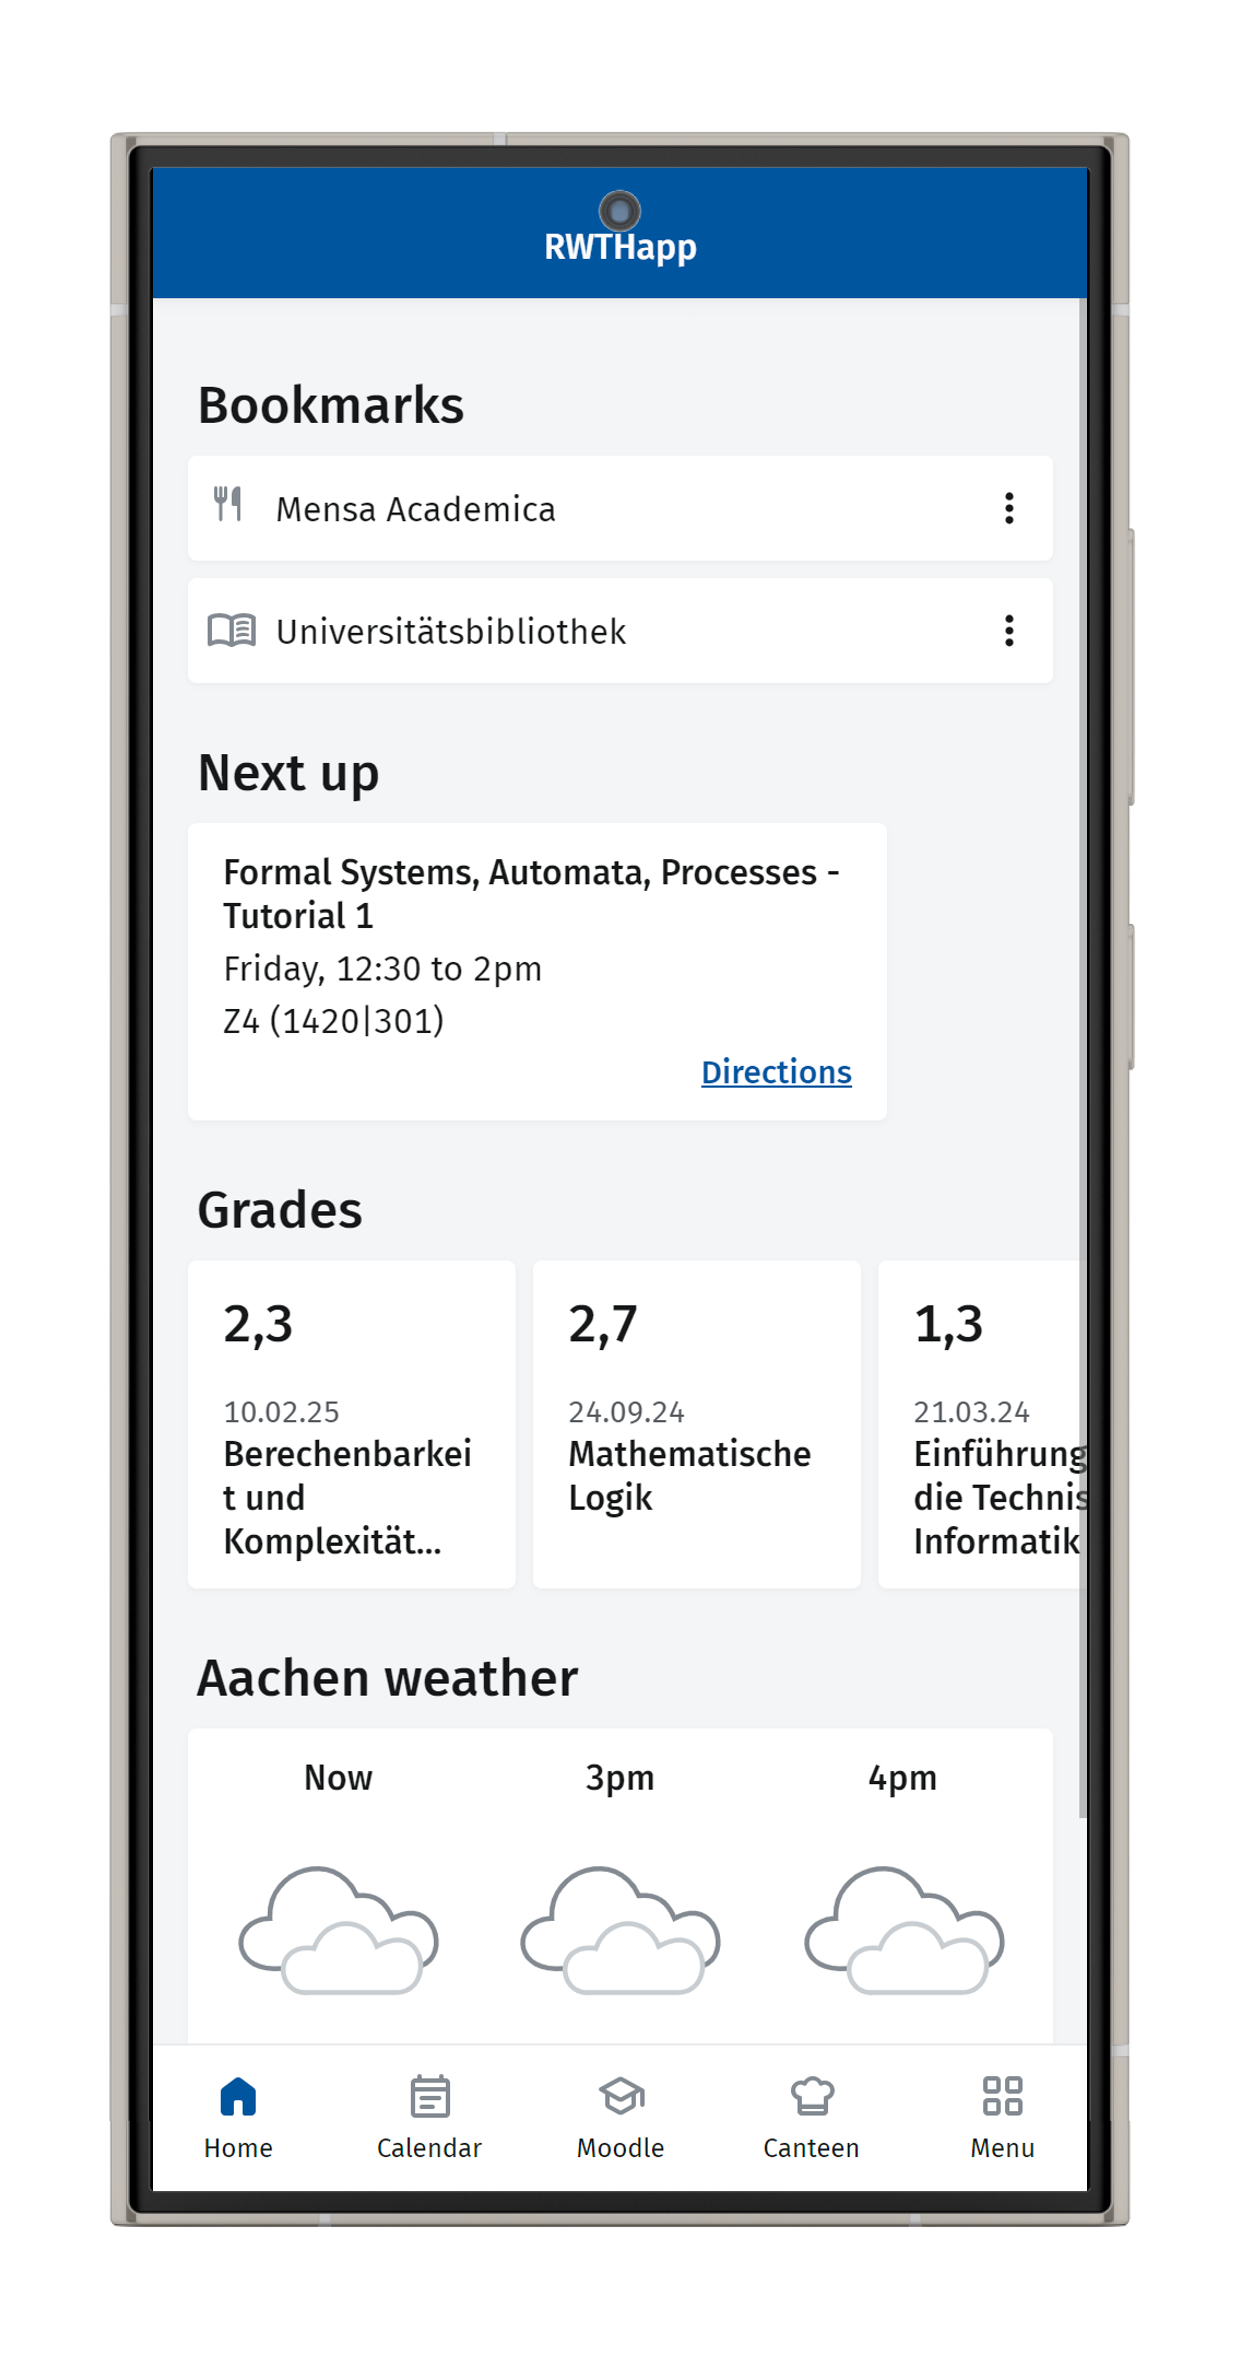
You can mark various topics as favorites. To do this, select the heart symbol in the top right corner. If the heart symbol is filled in, the page will be displayed under bookmarks on the home screen. The number of favorites you can mark is unlimited.
Weather
This widget shows you the current weather conditions in the city of Aachen.
Grades
Under grades, students will find the results achieved in their exams. The entries are sorted chronologically in descending order based on the exam date. Grades entered in RWTHmoodle are not displayed here. However, they can be viewed via the Moodle function in the navigation bar and then in the respective learning space under 'Grades'.
Calender
The calendar retrieves information from the calendar function and displays up to three appointments of the current week.
