

Favourites

Your favourites bar lists all your individually preferred services.

By clicking on a specific point, you will get to the corresponding Azure service (in this example: All Resources and Virtual Machines)
All Resources

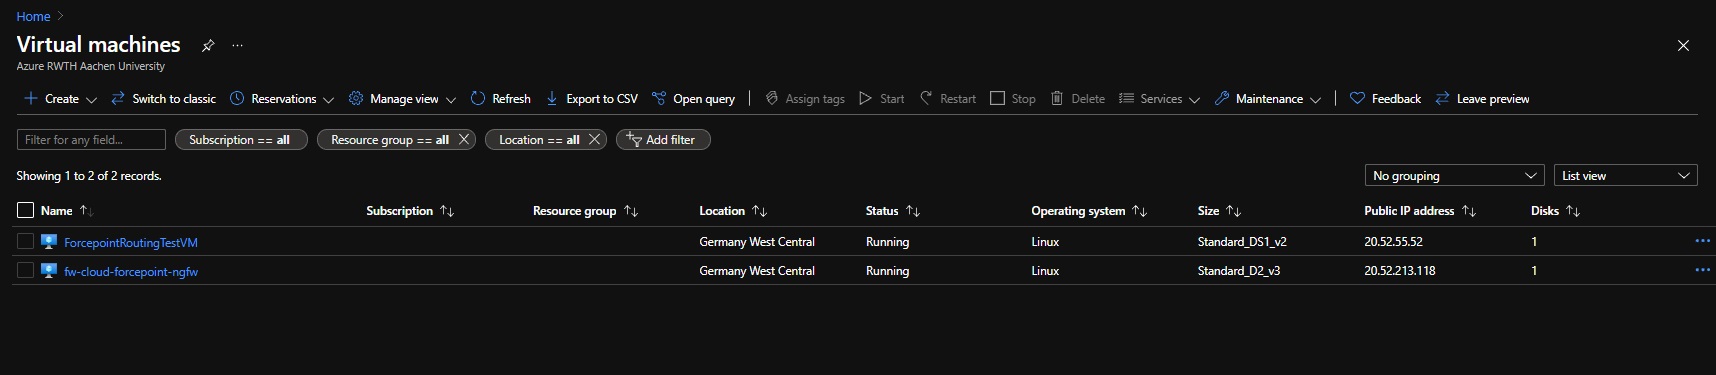
Virtual Machines
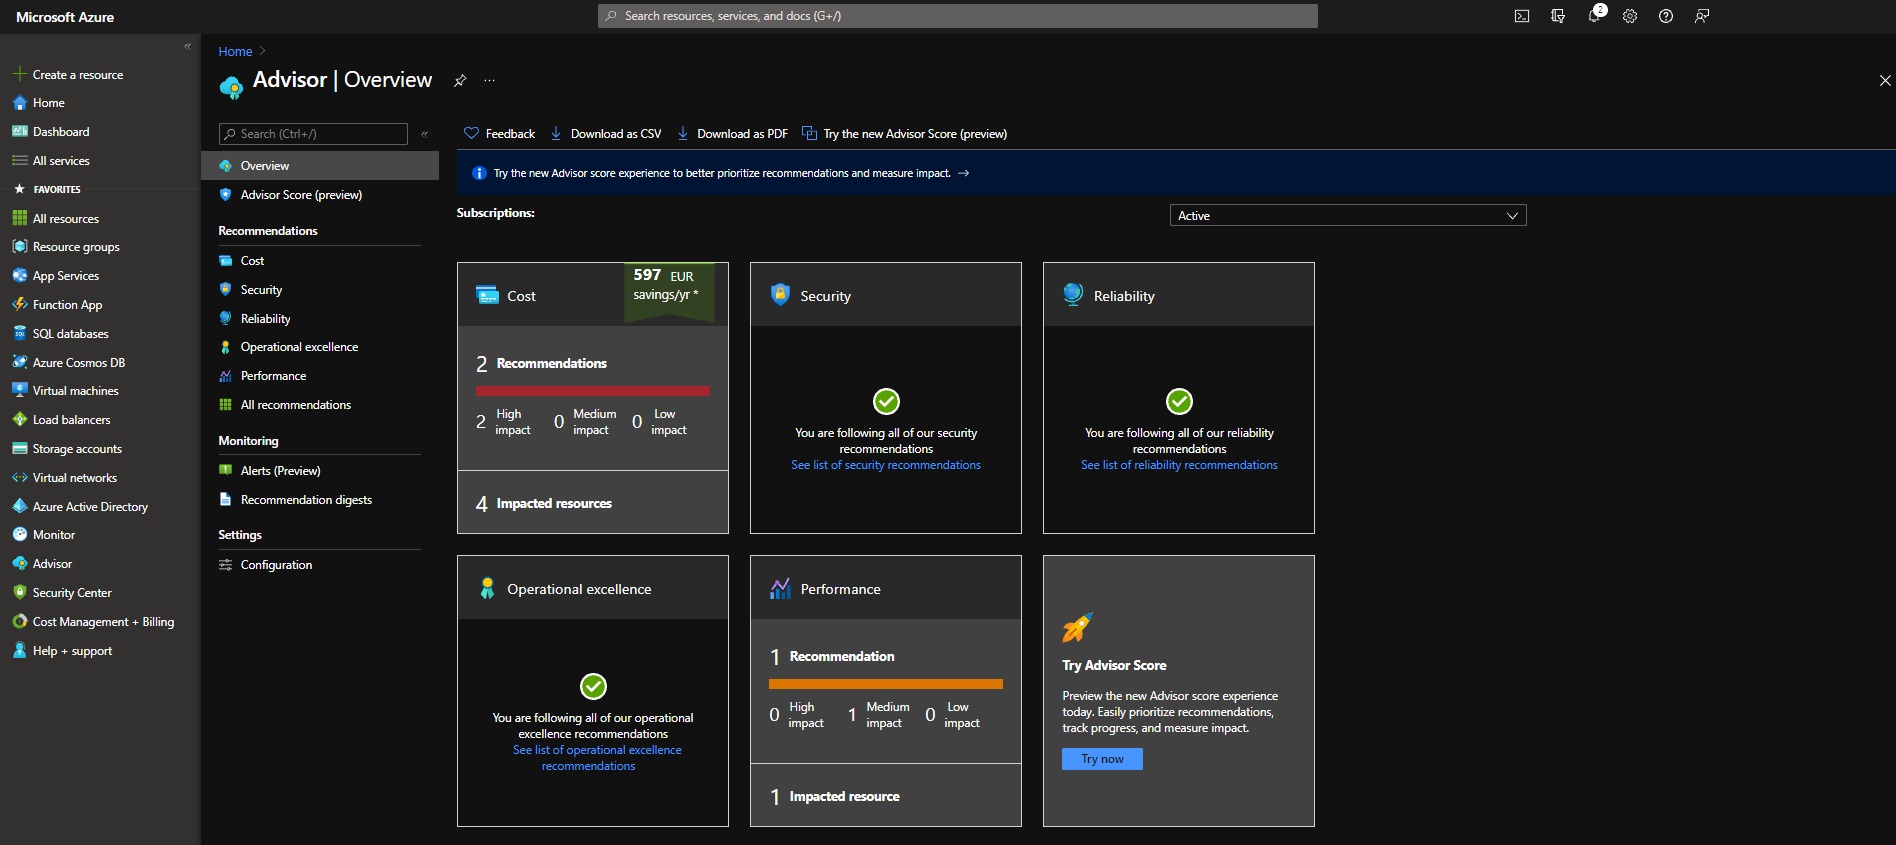
Advisor
The Advisor is an overview provided by Microsoft, which shows possible optimizations in your use of Azure.
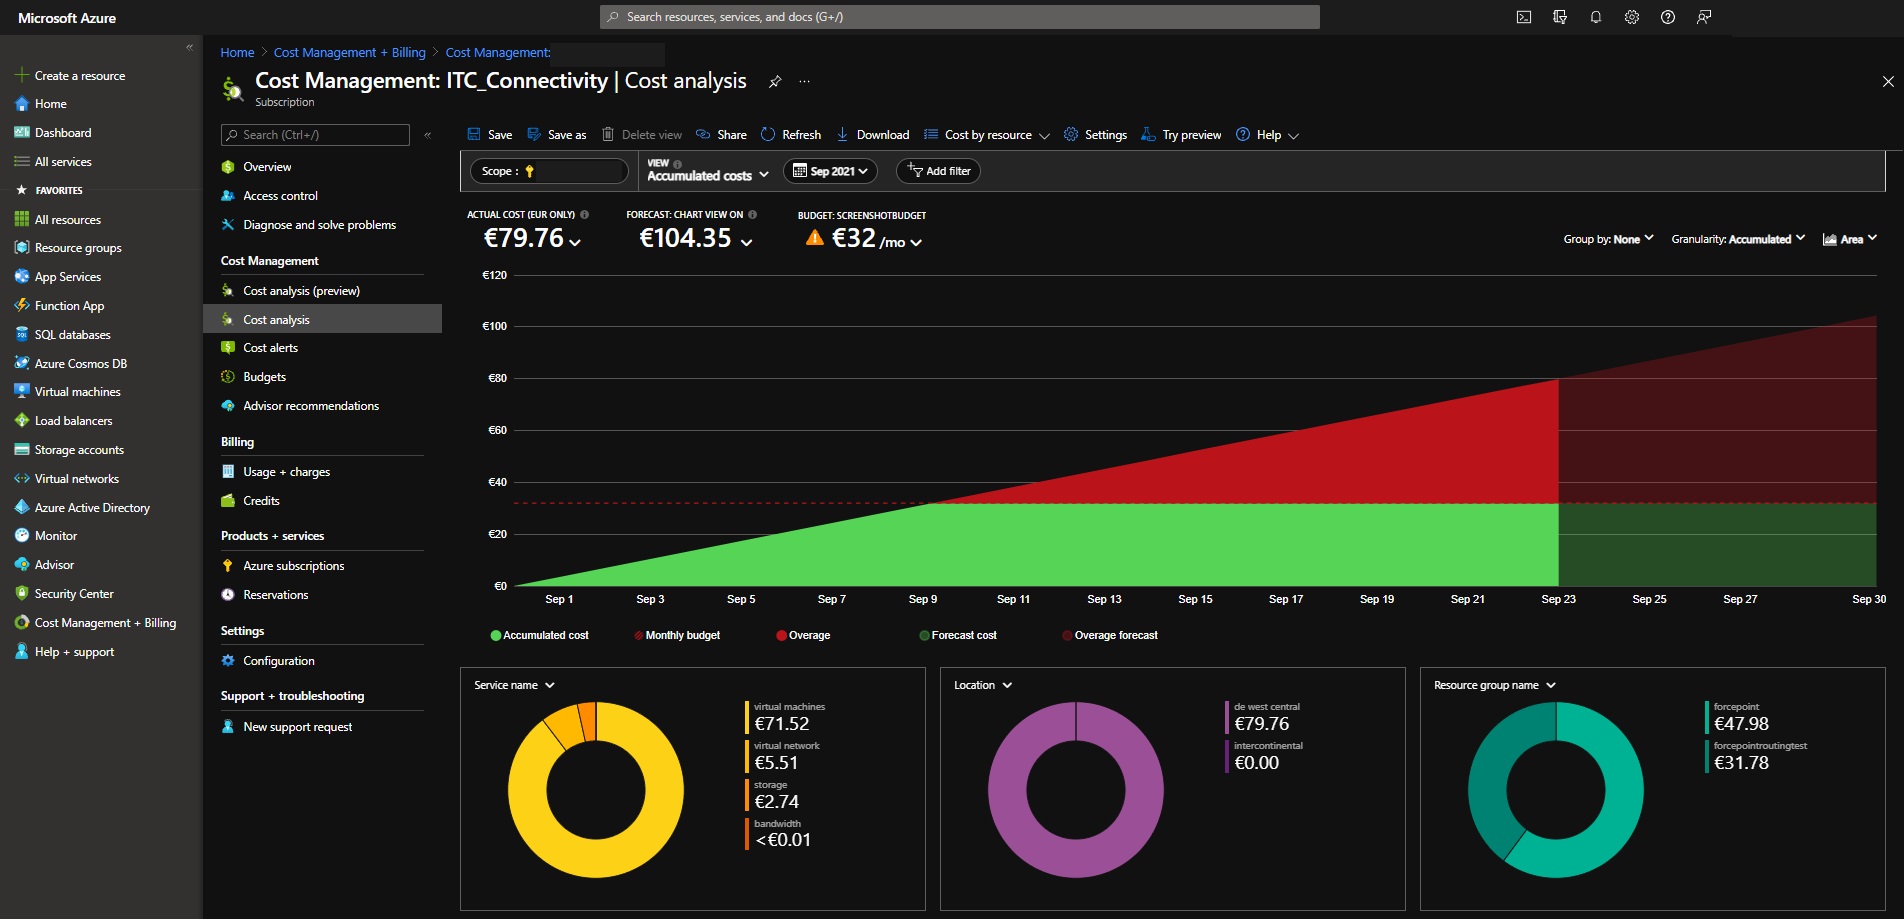
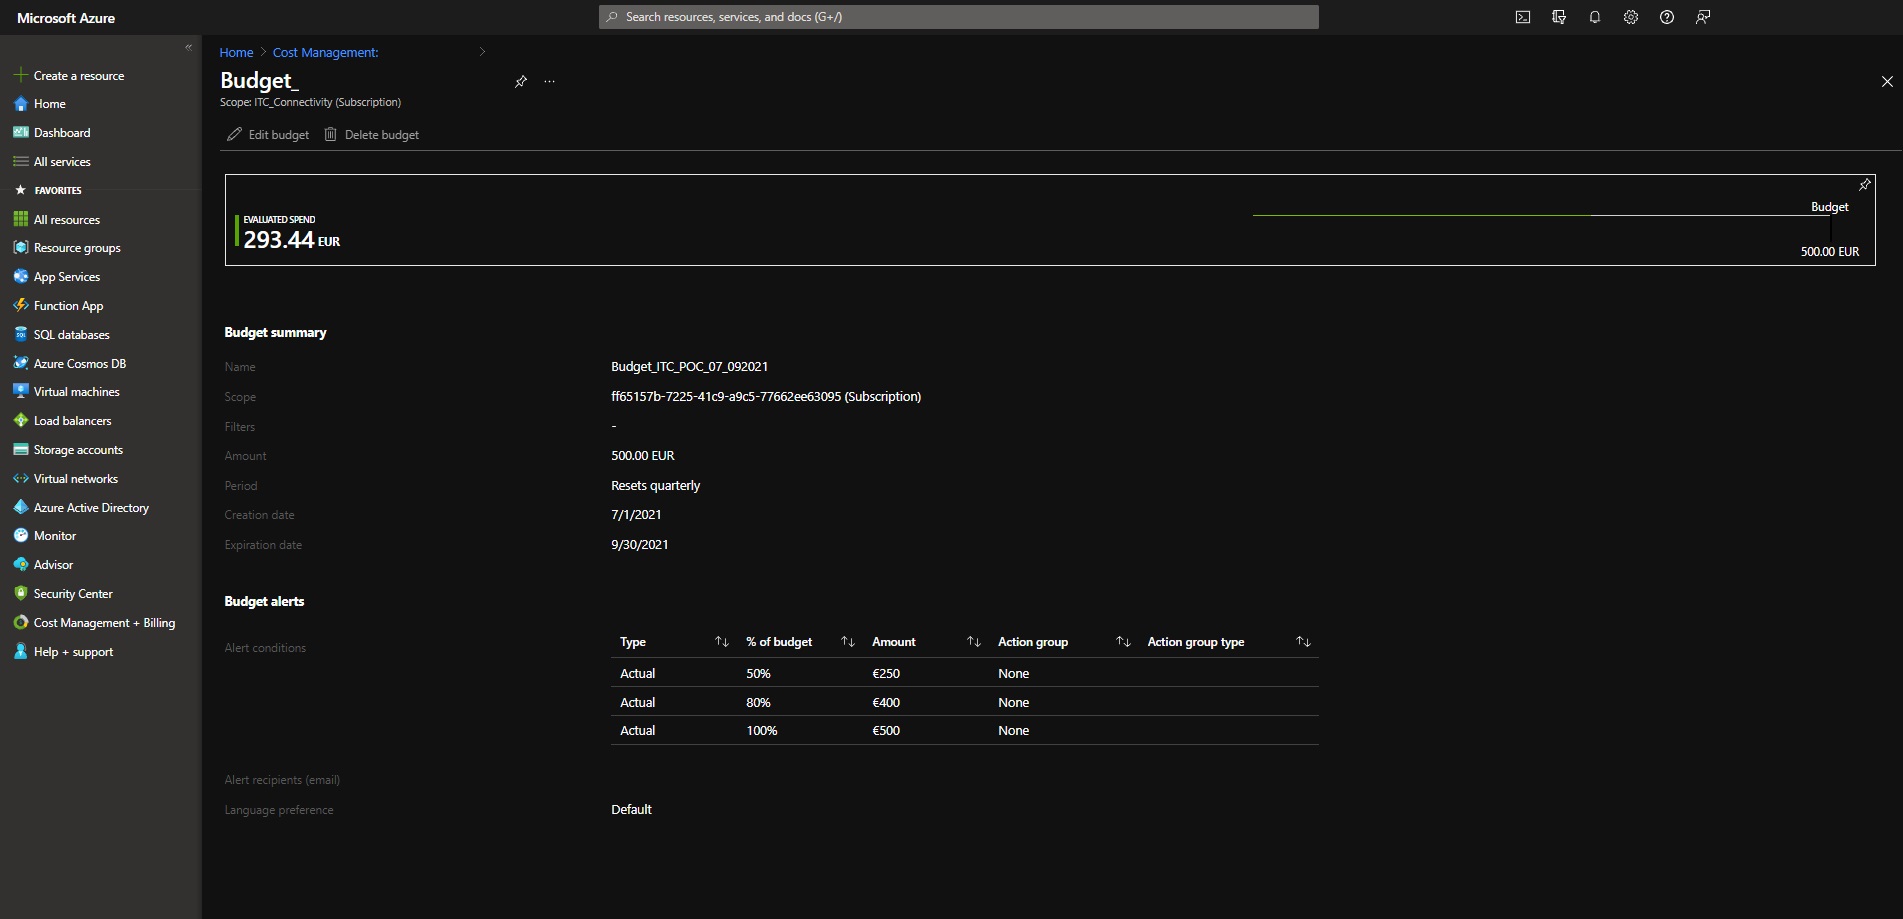
Cost Management
The cost management provides an overview of current and predicted future costs. You can select different scopes (monthly, quarterly, yearly, etc.)